Data visualization


Learning during COVID-19: Initial findings on students’ reading and math achievement and growth
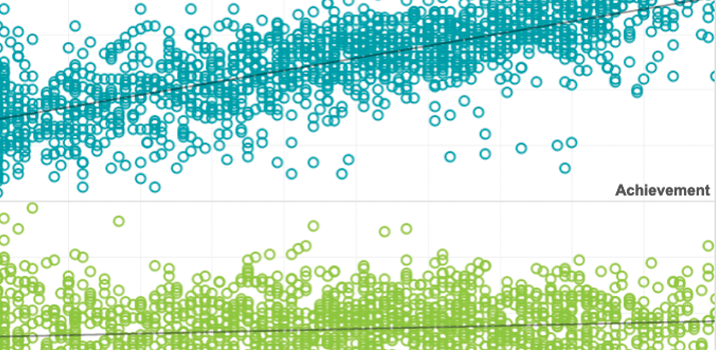
These visualizations allow you to explore key questions from our report, Learning during COVID-19: Initial findings on students’ reading and math achievement and growth.
By: Dave Moyer
Topics: Equity, COVID-19 & schools


Exploring the educational impacts of COVID-19
This visualization was developed to provide state-level insights into how students performed on MAP Growth in the 2020–2021 school year. Assessments are one indicator, among many, of the student impact from COVID-19. Our goal with this tool is to create visible data that informs academic recovery efforts that will be necessary in the 2022 school year and beyond.
By: Greg King
Topics: COVID-19 & schools, Innovations in reporting & assessment


